The Traceroute command is one of the easiest yet most effective ways of troubleshooting network issues. It is great software for checking the route from a computer to a hostname or an IP address. Almost every operating system includes it, so you can use Traceroute regardless of the kind of computer you are using.
Table of Contents
What is the Traceroute command?
The Traceroute command (Tracert on Windows) is a small network diagnostic software that you have built-in on your device and servers for tracing the route, hop by hop to a target.
Many network administrators use the Traceroute command daily. It is a convenient tool that you can use under different operation systems – Windows (Tracert), macOS, Linux (Traceroute), and even on mobile (Android and iOS).
To access the traceroute, you will need to use the Terminal (Linux and macOS) or the Command Prompt (Windows).
You can use the Traceroute and see the full route that the packets take to their destination (domain or IP address). Apart from that, you will see the hostnames and IPs of the routers on the way and the latency, the time it takes for each device to receive and resend the data.
You can see which gateway is discarding your data, and later you can fix it.
How does it work?
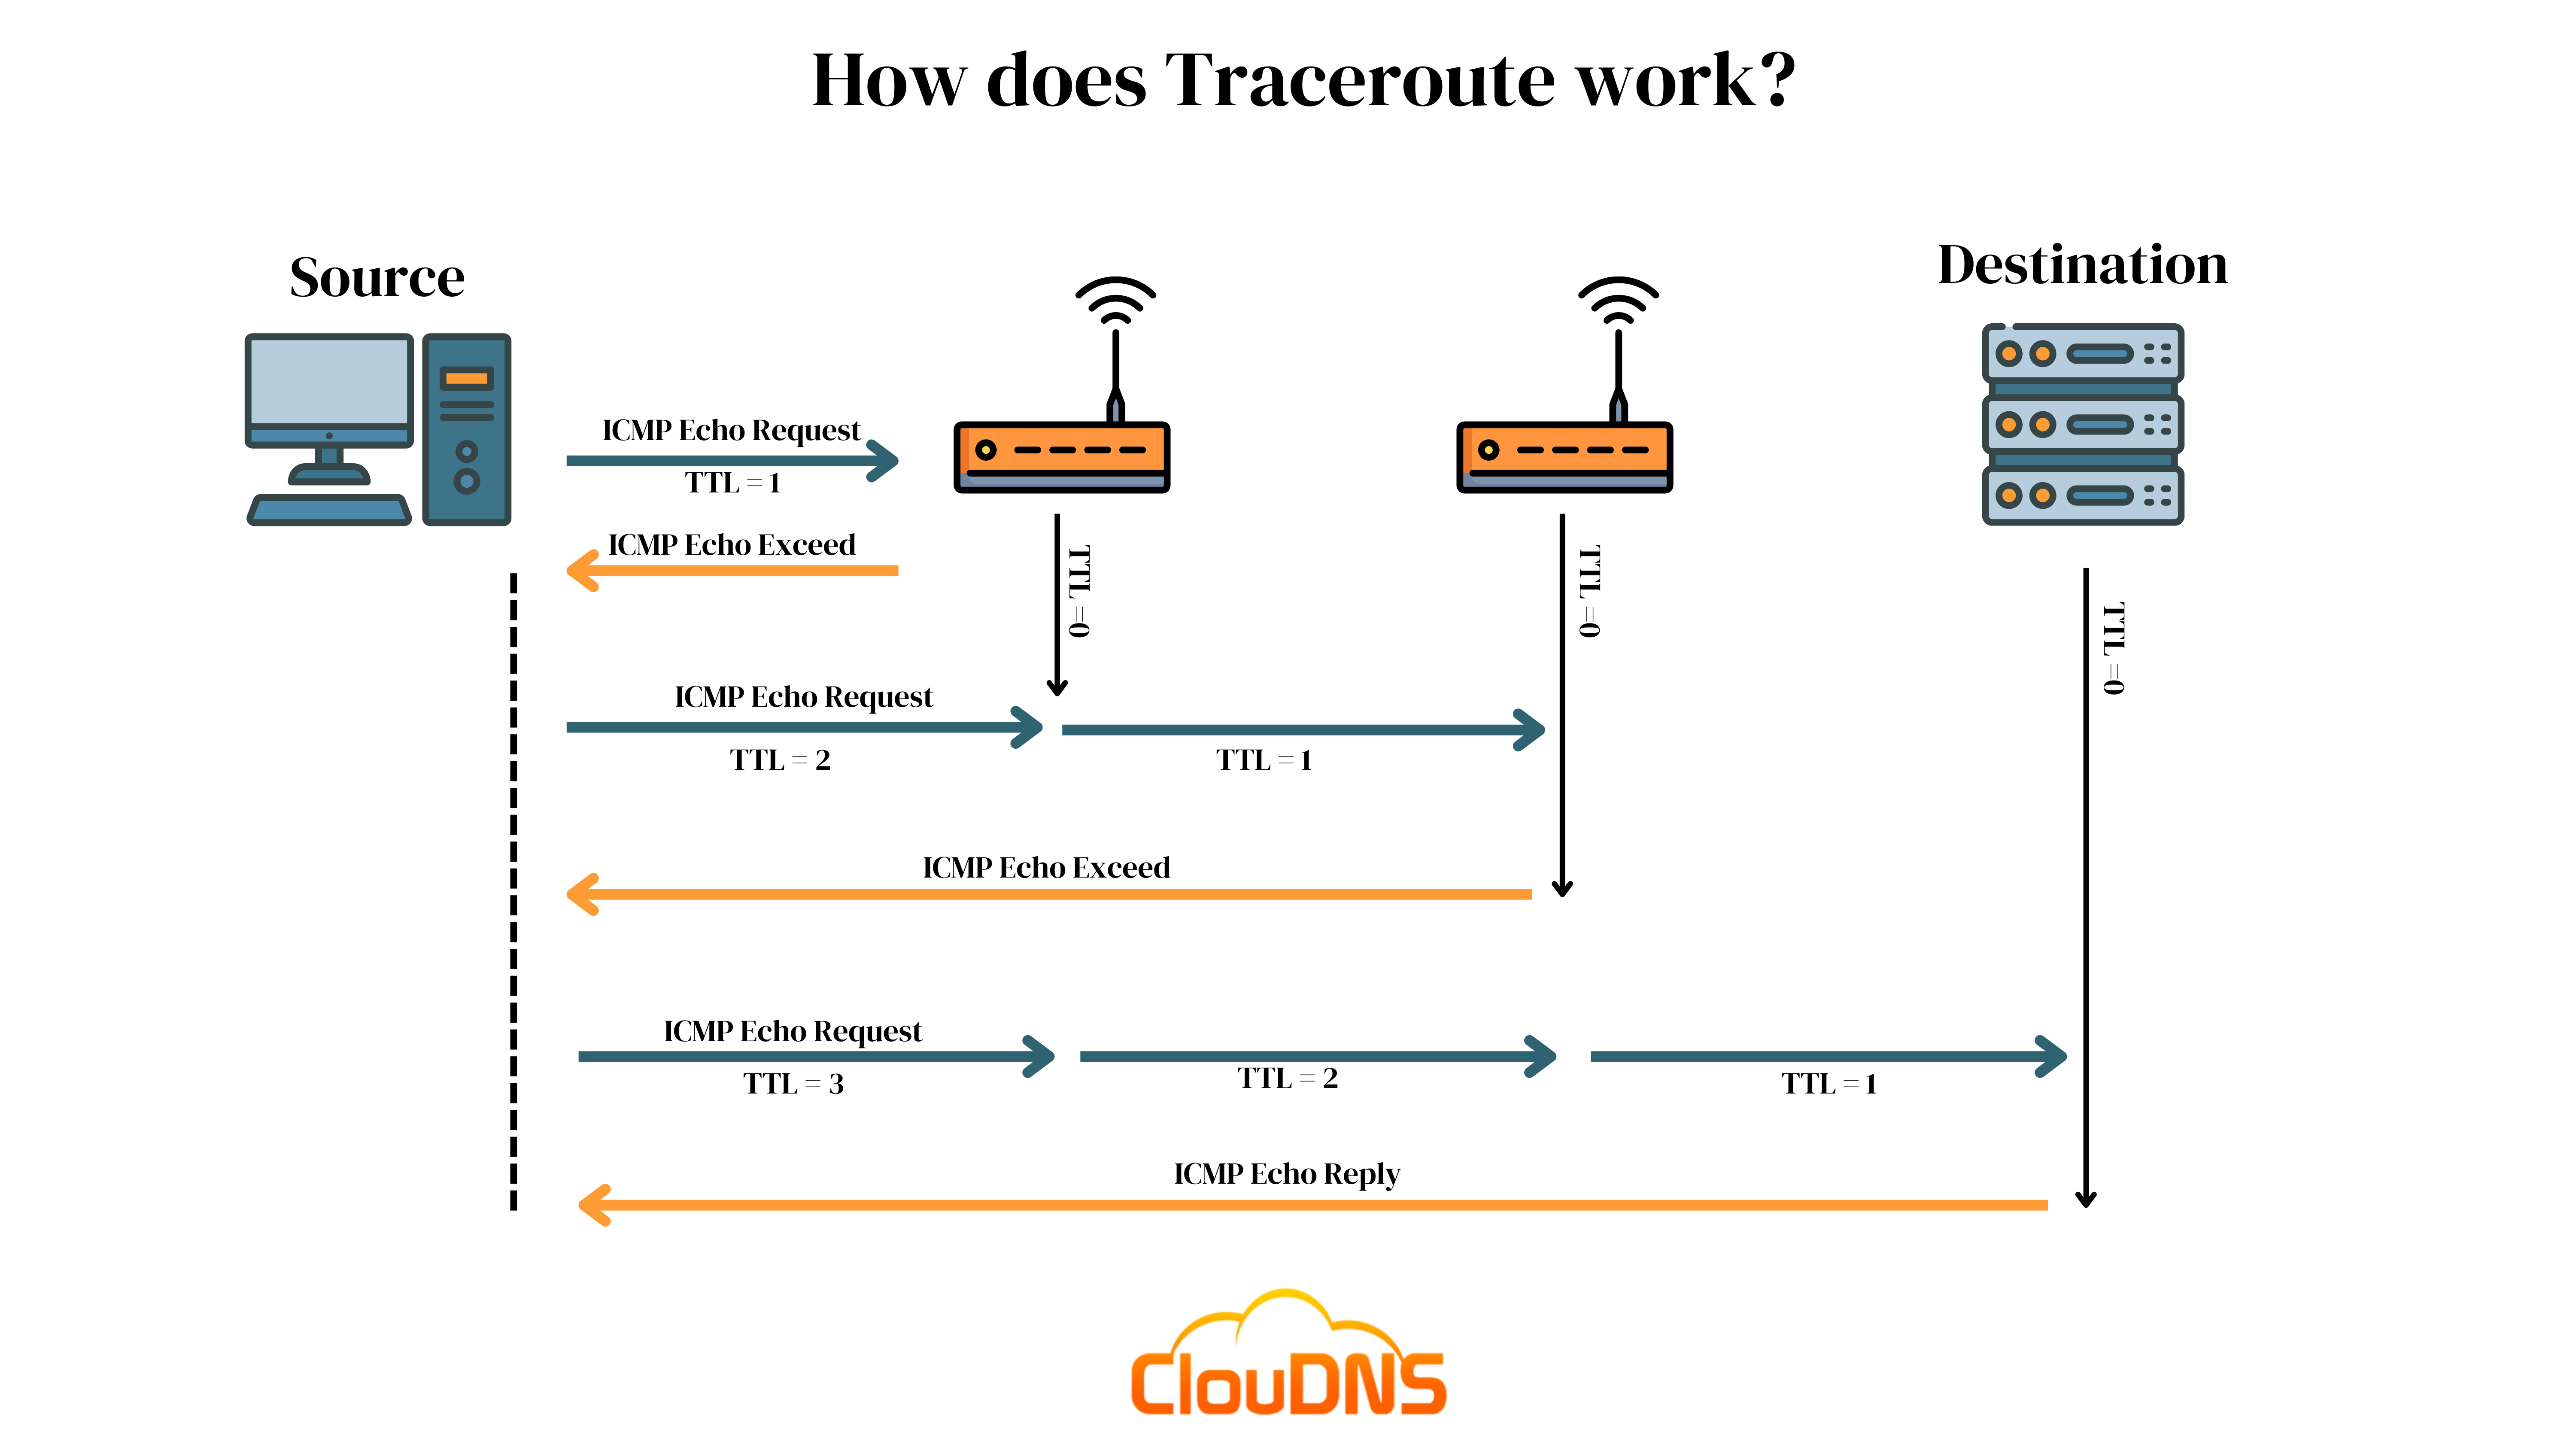
When you run a traceroute, you send an IP packet containing the source and destination addresses and the time to live (TTL) for each hop. TTL in packets decreases with each hop. This is to avoid server looping issues. Furthermore, when the TTL is reached, the packet expires and is discarded. When this occurs, Traceroute returns to the sender ICMP Time Exceeded messages (RFC 792). Because small TTL settings cause packets to expire quickly, traceroute forces all routers in a packet’s path to produce the ICMP messages that identify the router.
To better visualize the traceroute’s working mechanism, you can look at the following chart.
Why use the Traceroute or the Tracert command?
The benefits of using the traceroute command or its alternative for Windows called tracert command are:
- Complete route list. You will see all the routers on the way, with their IP addresses and the time it took. You can better understand the network.
- Route timing. See how much time does it take to finish the query. Is it ok for you? What can you do to speed it up? You can have a starting point for improvements.
- It is built-in. You don’t need to install additional software, and its use is free.
- Check if you can reach a target. See if there is a connection between your device and the hostname or IP address you put in the command.
- See problematic slow router. You can see how much time it took in each hop. So you can see a spot that significantly slows your network. You can fix the problem or add more presence in the area.
Ready for ultra-fast DNS service? Click to register and see the difference!Experience Industry-Leading DNS Speed with ClouDNS!
When will you need it?
Here are several scenarios where using a traceroute to diagnose a problem you are having can be necessary.
- Sluggish site
Run a traceroute from your computer to your website if you find it is operating slowly. With it, you will check for networking issues between your location and the server.
- Customer timeouts for email
Run a traceroute to assess the quality of the connection to the mail server if you have problems with your mail connection. In addition, you can find your mail server IP by running the following command: “ping smtp.server.com”. It will return the IP address of the Simple Mail Transfer Protocol (SMTP) server that you need for Traceroute purposes.
How to use the Traceroute command?
Use the Traceroute command by writing the command “traceroute + domain.com / IP address” or, in the Terminal on Linux and macOS or “tracert + domain.com / IP address” in the Command Prompt on Windows.
Traceroute (Linux and macOS)
traceroute domian.com or traceroute 12.23.34.45
Tracert (Windows)
tracert domian.com or tracert 12.23.34.45
On macOS, you can also use the Traceroute utility. Press the command button + space. Then write Network Utility. Inside it, navigate to Traceroute. Write the hostname or IP address and press enter. It will show you the result.
*You can change the domain.com with another domain you want to probe, and the same goes for the IP address.
Some differences between the Traceroute command, and the Tracert exist. Check the options below.
Traceroute command vs Tracert command
Apart from the small difference between typing traceroute and the Tracert, the fact that the first works on Linux and macOS, and the second on Windows, the other significant differences are the syntax and the options.
Syntax of the traceroute and Tracert commands
traceroute [options] host_Address [pathlength] (Linux)
traceroute [options] host [packetsize] (macOS)
tracert [-d] [-h maximum_hops] [-j host-list] [-w timeout] [-R] [-S srcaddr] [-4] [-6] target_name (Windows)
Example of Traceroute (Tracert on Windows)
The name of Traceroute on Windows is Tracert. It works very similar to the version on the other operating systems.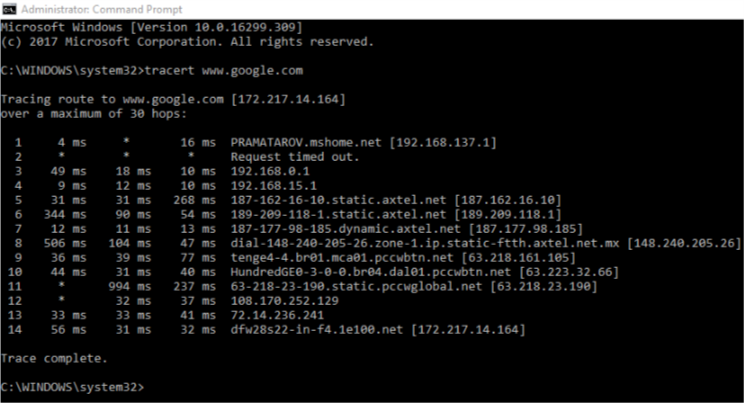
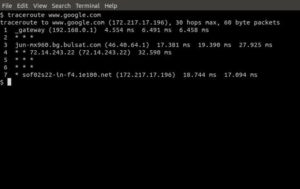
And this is how the Traceroute command looks on Linux and macOS:
Traceroute options for Linux
If you are a Linux user (Ubuntu, Linux Mint, Manjaro, Red Hat, Debian, etc.), you can specify your traceroute command with the following options:
|
Option |
Description |
|
–help |
Information about the command. |
|
-d |
This command enables debugging on Linux. |
|
-F |
Forbid fragmentation. |
|
-f first_ttl |
Put the first TTL value of the packet. |
|
-g gateway |
Define a loose source route gateway. |
|
-i interface |
Set the interface for the probes. |
|
-m max_ttl |
The TTL in traceroute means the maximum amount of hops. |
|
-N |
The number of probes that are sent at the same time (simultaneously). |
|
-n |
Stop the resolving of the IP addresses. |
|
-p port |
Define the port for the query. |
|
-t |
Set the type-of-service in probes. |
|
-w waittime |
Maximum waiting time for each of the replies. |
|
-q nqueries |
Set the number of queries. The default value is 3. |
|
-r |
Bypass the routing tables and send them to the host directly (on an attached network only). |
|
-S srcaddr |
IPv6 only – source address. |
|
-e |
Show ICMP extensions. |
|
-A |
AS lookups enable for each hop. |
|
-V |
Show version. |
|
-U |
Use a particular UDP port. The default value is 53. |
|
-UL |
Use the UDPLITE for the query. |
| -P protocol |
Send packets of a specified IP protocol. |
|
-I |
Use the ICMP echo for the requests. |
|
-T |
Use the TCP SYN for the requests. |
| -4 |
Use only IPv4 addresses |
| -6 |
Use only IPv6 addresses |
Traceroute options for Windows
You can use the Tracert command with various options to perform more precise tests. The following options work on Windows Vista, Windows 7, Windows 8, and of course, Windows 10.
| Option |
Description |
|
-d |
Do not resolve addresses to hostnames. |
|
-h aximum_hops |
Maximum number of hops to search for target. You can put higher than 30, if you want to query a very remote target. |
| -j host-list |
Loose source route along host-list (IPv4-only). Show only IPv4 addresses. |
| -w timeout | Wait timeout milliseconds for each reply. Inscrease it, to see more about slower routers. |
|
-R |
Trace round-trip path (IPv6-only). |
|
-S srcaddr |
Source address to use (IPv6-only). |
|
-4 |
Force using IPv4. |
|
-6 |
Force using IPv6. |
Traceroute options for macOS
While the Traceroute command on macOS is very similar to its Linux version, there are small differences in their options.
|
Option |
Description |
|
-a |
AS# lookups enable for each hop. |
|
-d |
Socket level debugging. |
|
-D |
When an ICMP response to our probe datagram is received, print the differences between the transmitted packet and the packet quoted by the ICMP response. |
|
-e |
Mode – Firewall evasion. The ports for UDP and TCP will be fixed and won’t increase with each hop. |
|
-f first_ttl |
Put the first TTL value of the packet. |
|
-F |
Forbid fragmentation. |
|
-g gateway |
Define a loose source route gateway. |
|
-i iface |
Set the interface for the probes. |
|
-I |
Use the ICMP echo for the requests. |
|
-M first_ttl |
Same as -f. |
|
-m max_ttl |
Set the maximum amount of hops. By default, it is set to 30. |
|
-n |
Show the hop addresses numerically. |
|
-P proto |
Send packets of a specified IP protocol. |
|
-p port |
Define the port for the query. |
|
-q nqueries |
Put a specific number of queries. The default value is 3. |
|
-r |
Bypass the routing tables and send them to the host directly (on an attached network only). |
|
-S srcaddr |
IPv6 only – source address. |
|
-S |
Summary of unanswered probes. |
|
-t |
Set the type-of-service in probes. |
|
-v |
Verbose output. |
|
-w |
Set waiting interval (in seconds) for a response. The default value is 3. |
|
-x |
Toggle IP checksums. |
|
-z |
Set a pause (in seconds) between the probes. The default value is 0. |
Traceroute Port
When you run a Traceroute command, your computer sends small data packets to a destination using specific network ports, depending on the operating system and protocol chosen (UDP, ICMP, or TCP). These ports help initiate the connection and track the path of the packets through various routers.
On Linux and macOS, Traceroute usually sends UDP (User Datagram Protocol) packets to destination ports ranging from 33434 to 33534 by default. With each new probe, the port number increases. These ports are rarely used for other services, making it easier to track the route. If a firewall blocks these ports, Traceroute might fail or return incomplete results.
On Windows, the tracert command uses ICMP Echo Requests, which don’t rely on traditional port numbers. This means Windows traceroute behaves more like the Ping command but with a gradually increasing TTL (Time To Live) to map each hop along the route.
Knowing which port is used matters when you’re dealing with firewalls or network filtering. If your traceroute results suddenly stop at a certain point, a firewall might be blocking the default UDP ports or ICMP packets.
In Linux and macOS, you can specify the destination port with the -p option if needed.
For example:
traceroute -p 80 example.com
This tells Traceroute to use port 80, which is often open for web traffic.
This flexibility is useful when you suspect that only specific ports are being blocked or prioritized in your network path.
Save Traceroute results for later analysis
Traceroute outputs can be long and detailed, especially when diagnosing complex networks. Saving the results for future analysis helps document network issues, allowing users to track changes, compare routes, or share the data with colleagues or support teams.
To save traceroute results to a file, simply redirect the output into a text file using the following syntax:
For Linux/macOS:
traceroute example.com > traceroute_results.txt
For Windows:
tracert example.com > tracert_results.txt
This command captures the entire output of the traceroute (or tracert) command and saves it in a file called traceroute_results.txt in the current directory. You can then review or share this file at any time, making it easier to troubleshoot ongoing network issues without needing to rerun the command.
The TTL and Traceroute
Each packet that you send contains a TTL (time to live). It is not a time but a limit of hops it can do before getting the result.
Usual limit is 30, but it can be more like 64 for example. This limit stops your data after a certain amount of hops so it won’t go forever. The IP packet will follow until it gets “time exceeded” or “port unreachable” when it gets to the host.
Starting at 30, on the next hop, it will drop to 29 and so on. If it can’t find the domain or IP that you wanted it will display a message where did it fail, so you will know where the problem is.
Distinction between Ping and Traceroute
Both Ping and Traceroute are tools for analyzing networks. However, the Traceroute is a little more advanced. For example, ping will check the connectivity between two hosts but does not reveal the route between them. On the opposite, the Traceroute shows every stop between the source and the final destination. This can be helpful when connectivity is patchy, such as when only 50% of ping attempts between two places are thriving.
So, to sum up, the Traceroute command can be used to identify connectivity issues, while ping is a quick approach to determine whether a host is reachable over a network. Both of these commands are beneficial to be aware of because knowing how they operate and what their output denotes can be very valuable when analyzing network connectivity issues.
Traceroute’s Restrictions
- It establishes the route at the interface level rather than at the router level.
- The Traceroute may not respond after crossing the maximum number of hops if there are firewalls between the source and destination routers that prevent the probe packets from being sent. Furthermore, despite the hops IP address, the router will display * (asterisk) if no response is received. Therefore, using a traceroute under these circumstances is not suggested.
- Based on the IP headers, load balancing routers can route the traffic via a number of different paths. Therefore, if we execute a traceroute in this case, it will give us an incorrect path between the origin and the goal. Accordingly, it is not advisable to employ traceroutes in this circumstance either.
Are there alternatives to the traceroute command?
Yes, there are various alternatives to the traceroute commands like MTR command, Dig command, Open Visual Traceroute, Nmap.
MTR command (Linux and macOS)
mtr domain.com
The MTR command is an improved traceroute command that can give more statistics and data for lost packets (percentage).
Dig command (Linux and macOS)
dig +trace domain.com
If you already use the Dig command, you can use it for tracing the route too.
Open Visual Traceroute (Linux, macOS, and Windows)
This one is for people who want a visual interface. It is heavier, but it can show you, in a graphical way, the route of the queries and also get Gantt graphs.
Nmap (Linux, macOS, Windows, BSD, and more)
nmap –traceroute domain.com
The results are very similar to the traceroute command.
Conclusion
By using the newly collected data, you can see if there is any problem on the route (not responsive server or very slow one) and later focus your attention to fix it. If you want to see few more tools you can check one of our previous article Тools – DNS trace, Ping, Traceroute, Nslookup, Reverse lookup.