Uptime monitoring usually works quietly in the background. Checks run, services respond, and most of the time nothing unusual happens.
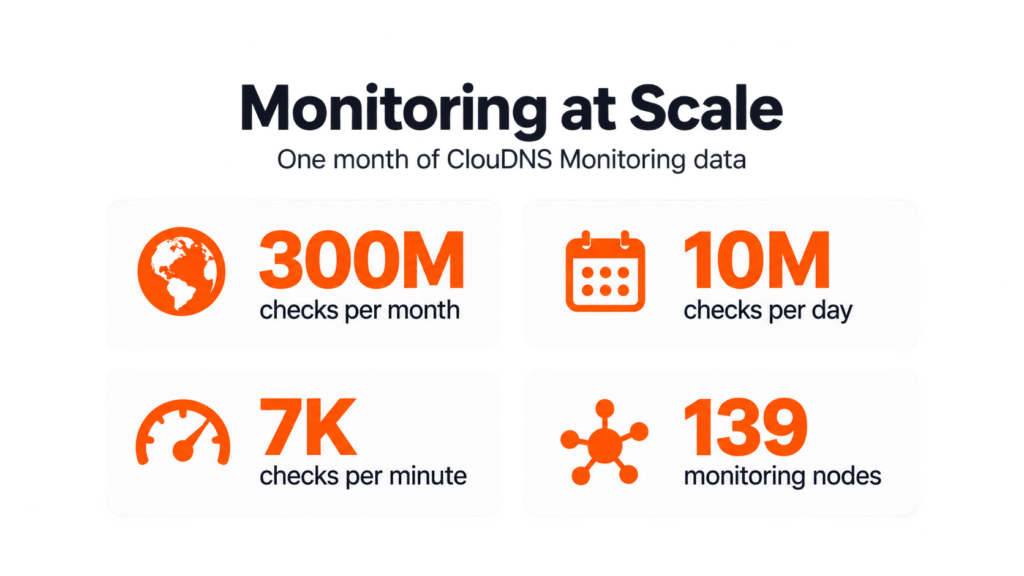
But when you look at a full month of monitoring data, the scale tells a much bigger story. In one month, ClouDNS Monitoring performed around 300 million checks, giving us a closer look at how customers monitor their services and what kinds of problems appear most often.
Table of Contents
How does ClouDNS Monitoring work?
ClouDNS Monitoring regularly checks whether a service is available and responding as expected.
Depending on the service, that could mean checking a website, DNS server, IP address, TCP or UDP port, mail server, SSL certificate, cron job, firewall, or streaming service.
The process itself is straightforward: run a check, verify the response, detect a status change, and send an alert.
Each monitor runs at a selected interval, which makes it possible to detect problems automatically instead of waiting for a customer or administrator to notice them first.
Checks are also performed through a distributed monitoring network. This matters because a service can work normally from one part of the Internet while users elsewhere experience routing problems, packet loss, filtering, or other connectivity issues.
Monitoring at scale
Over one month, our monitoring infrastructure performs approximately 300 million checks. That works out to around 10 million checks every day, or roughly 7,000 checks every minute.
Those checks are handled across 139 monitoring nodes, giving us multiple points from which to test service availability.
A single monitoring point can tell you whether a service works from one location. A distributed network gives a broader picture and can make regional or network-specific problems easier to spot.
Customer Monitoring patterns
The data shows a clear difference between how Free and paid Monitoring customers configure their checks.
For Free Monitoring, the most commonly selected monitoring interval is 1 hour. For paid Monitoring, the most popular interval is 1 minute.
That reflects two different monitoring needs. An hourly check can provide useful visibility when basic availability monitoring is enough. For production websites, APIs, DNS services, and other important systems, a one-minute interval can reveal a problem much sooner.
Customers also use the full range of monitoring checks available in ClouDNS, with Ping Monitoring being the most widely used check type.
| Monitoring type | What it checks |
| Ping Monitoring | Host availability, latency, and packet loss |
| Web Monitoring | HTTP/HTTPS availability and responses |
| DNS Monitoring | DNS responses and expected records |
| Keyword Monitoring | Whether expected content is present in a web response |
| Heartbeat Monitoring | Cron jobs, servers, devices, and processes expected to report regularly |
| TCP Monitoring | Availability of a specific TCP port |
| UDP Monitoring | Availability of services using UDP |
| SSL Monitoring | SSL/TLS certificate availability and validity |
| Firewall Monitoring | Whether selected network ports are open or closed as expected |
| SMTP Monitoring | SMTP mail server availability |
| IMAP Monitoring | IMAP mail server availability |
| Streaming Monitoring | Audio stream availability and performance |
One successful check does not necessarily mean the entire service is healthy. A server can respond to Ping while its website is unavailable. A website can return an HTTP response while important content is missing. A server can be online while one of its mail services has stopped accepting connections.
Different checks provide visibility into different layers of a service.
Around 40,000 Incidents in One Month
Most uptime monitoring checks simply confirm that everything is working normally. Across hundreds of millions of checks, however, problems inevitably appear.
In an average month, ClouDNS Monitoring detects around 40,000 incidents. That is approximately 1,300 detected incidents per day.
These incidents can range from short connectivity problems to services that stop responding completely.
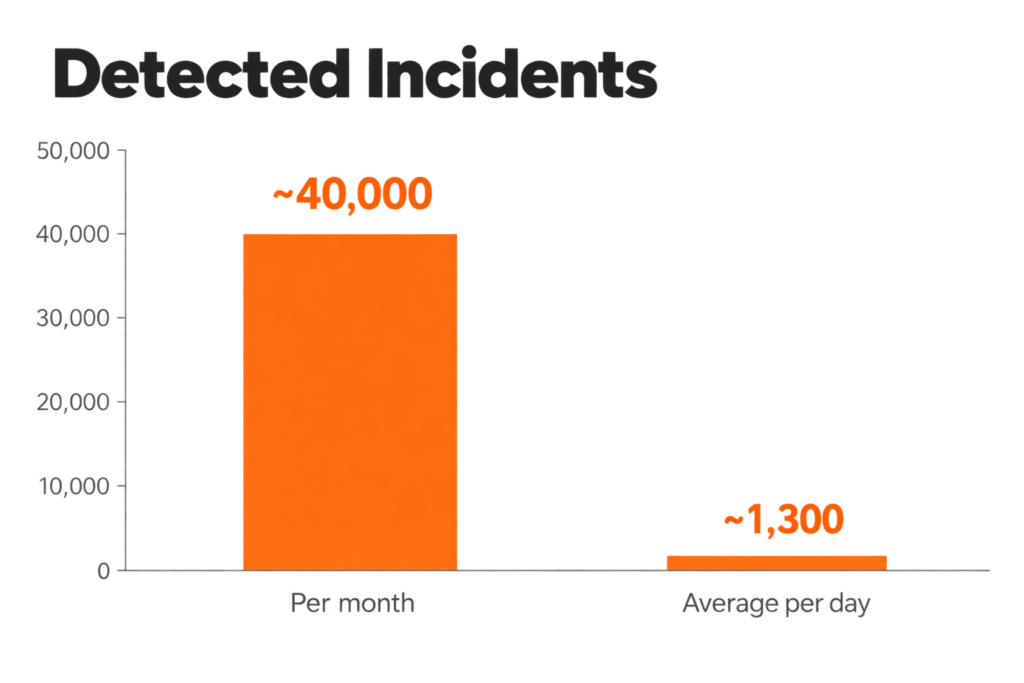
The volume is important because every detected incident represents a point where the monitored service stopped behaving as expected. Some failures may last only briefly, while others can indicate a larger network, server, or application problem.
The problems we see most often
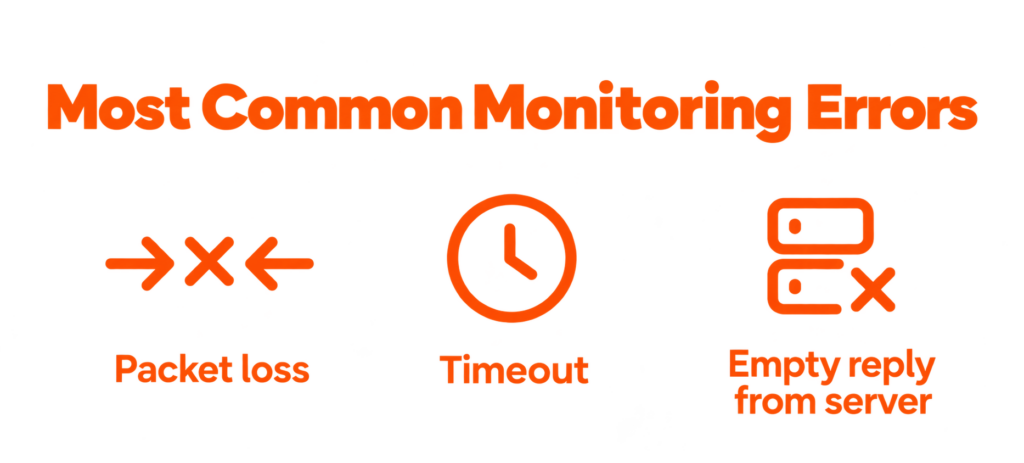
The most common problem in our monitoring data is packet loss.
That is closely connected to Ping being the most widely used monitoring check. Ping checks whether packets sent to a monitored host successfully return. When some of them do not, packet loss is detected.
Packet loss does not always mean that a service is completely unavailable. It can also indicate unstable connectivity, congestion, routing problems, overloaded network equipment, or another issue somewhere between the monitoring node and the destination.
Web Monitoring reveals a different set of problems. Two of the most common failure reasons we see are Timeout and Empty reply from server.
A Timeout occurs when the monitored web service does not respond within the expected period. The server may still be running, but from the user’s perspective, a service that does not respond in time can still be a serious problem.
An Empty reply from server means a connection was established, but the server closed it without returning the expected HTTP response.
Both are good examples of why useful monitoring goes beyond a simple UP or DOWN status. Knowing how a check failed can provide the first clue about where troubleshooting should begin.
What does the data show about service health?
The monthly data makes one thing clear: monitoring is not only about detecting complete outages.
A service can still be online while experiencing packet loss, failed web requests, regional connectivity problems, or issues affecting only one part of its infrastructure.
That is also why monitoring frequency matters. An hourly check and a one-minute check can both confirm availability, but they provide very different levels of visibility when something goes wrong.
The same applies to monitoring types. Ping can tell you whether a host is reachable, but it cannot confirm that a website is returning the expected content, that an SSL certificate is working correctly, or that a mail service is accepting connections.
The closer the uptime monitoring setup matches the actual service, the more useful the resulting data becomes.
From Detection to Status Communication
Detecting a problem is only one part of incident management. Once something goes wrong, customers also need to know what is happening.
Monitoring helps the technical team answer “Is something wrong?” A Public Status Page helps customers answer “Is the service having a problem right now?”
Together, they create a straightforward flow:
Monitor → Detect → Alert → Fix → Communicate
Without monitoring, a team may first hear about an outage from its customers. Without clear status communication, the technical team may already be working on the problem while users are still refreshing the page, checking their own connection, or opening support requests.
A Public Status Page gives users a central place to check the current availability of the services they depend on.
If you’re not using Status Pages yet, you can add one at ClouDNS for $2/month per page to keep your customers updated on service availability. Activate Status Pages
Turning uptime Monitoring data into action
With uptime monitoring, more checks do not automatically mean better monitoring. What matters is whether the alerts help teams identify real problems and respond quickly.
A single failed check can sometimes be temporary, while repeated failures may point to a more persistent issue. Setting sensible monitoring intervals and alert conditions helps reduce unnecessary noise and makes important incidents easier to spot.
This becomes even more important as monitoring grows, since too many low-value alerts can lead to alert fatigue and make critical problems easier to miss.
Conclusion
Hundreds of millions of checks run quietly in the background every month, but together they provide valuable visibility into how online services behave.
From packet loss and web timeouts to DNS, mail, SSL, ports, and background processes, continuous monitoring helps teams detect problems earlier, understand what is happening, and respond with better context.